
University News
![[Download Print-Quality Image]](http://www.wiu.edu/images/news/16753/16753_9264_1.jpg)
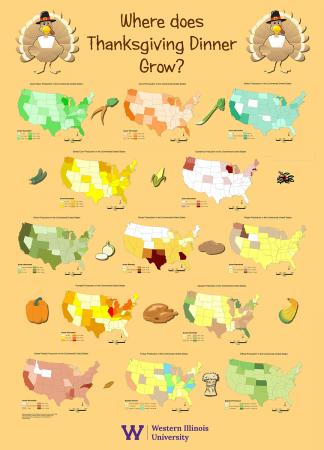
WIU Libraries Faculty Develops Mapping Project to Teach Thanksgiving Lessons
October 21, 2019
MACOMB, IL – A faculty member in the Western Illinois University Libraries has developed a mapping project to show where the components of Americans' Thanksgiving dinners are grown.
The GIS project was started as a way for Government Information and Data Services Librarian
Linda Zellmer to help her sister, who was a teacher and wanted to inspire her students during the weeks approaching Thanksgiving.
"I originally started mapping Thanksgiving dinner because GIS Day, which is a day during Geography Awareness Week when geospatial technologies are highlighted, sometimes falls shortly before Thanksgiving," said Zellmer. "I develop the maps using ArcMap, a geographic information system (GIS) program, that can be used to organize, analyze, visualize and communicate data. I tried to think of what I could map for GIS Day (which is Nov. 13 this year) that might also be useful to teachers, like my sister."
To create the maps, Zellmer began by downloading data on which states produce the various Thanksgiving dinner foods from the Census of Agriculture. She then connected the data to the geographic boundaries for the continental United States.
"The GIS system can be used to create a variety of maps with the data including graduated color maps," said Zellmer. "I could also show the data as a chart. The technology is really powerful and can be used in a variety of fields, from agriculture, to healthcare, or even emergency response. GIS has a lot of employment growth because the technology can be used in so many different fields."
Zellmer said her sister taught lessons on nutrition and would bring in grocery store ads prior to the holiday. She said she has been contacted by other teachers who said the maps are good geography exercises.
"The kids would plan a balanced menu, figure out how much food they need to feed the class (number of turkeys, pies, etc.), and then calculate how much it would cost to feed the class," she said. "Thus, they learned some geography, nutrition and math."
The maps have been combined into a poster that will be on display in the Malpass Library in the coming weeks. The display also contains pumpkins grown by Greg Phelps, a library operations associate in the Access Services unit. Current and historical maps for each food item are available online at faculty.wiu.edu/LR-Zellmer/thanksgiving.html.
In addition to developing maps and a poster showing which states grow the foods eaten at Thanksgiving dinner, Zellmer has developed a story map with the data. A story map is an interactive map that contains information about the maps and what they show. Story map users can interact with the data behind the map, for example, users can click on a state to see how many acres of carrots (or other Thanksgiving foods), and the number of turkeys or bushels of wheat are grown in a particular state. The Thanksgiving Dinner story map can be found at arcg.is/Cznmn.
For more information about the libraries at WIU, visit wiu.edu/libraries.
Posted By: University Communications (U-Communications@wiu.edu)
Office of University Communications & Marketing
Connect with us: