
WIU Librarian's Updated GIS Project Tracks Thanksgiving Foods
November 20, 2014
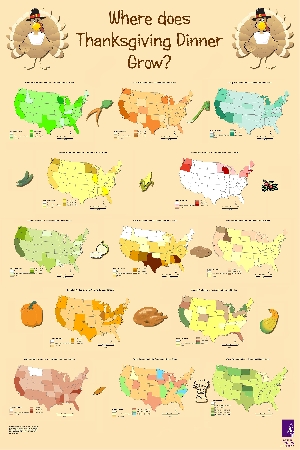
What do Thanksgiving foods and geographic information systems (GIS) have in common? They are both components of the updated "Where Does Thanksgiving Dinner Grow?" project created by Linda Zellmer, government and data services librarian at Western Illinois University Libraries. To explore Zellmer's project, visit http://faculty.wiu.edu/LR-Zellmer/thanksgiving.html.
[Download Print-Quality Image]
![[Download Print-Quality Image]](http://www.wiu.edu/images/news/12125/12125_4090_1.jpg)
MACOMB, IL — What do Thanksgiving foods and geographic information systems (GIS) have in common? They are both components of the updated "Where Does Thanksgiving Dinner Grow?" project created by Linda Zellmer, government and data services librarian at Western Illinois University Libraries.
To help people understand how geographic information systems (GIS) can show information and to celebrate Geography Awareness Week (Nov. 16-22), Zellmer has utilized GIS to prepare a set of maps and a poster that show where the foods—such as turkey, cranberries, squash and green beans—consumed at the traditional Thanksgiving meal are grown/produced in the United States.
"GIS is a collection of computer software and data used to organize and view geographically referenced information—it helps people collect and organize information about places, so that it can be easily displayed. I have done this about every five years [1997, 2002, 2012], but the data release for 2012 was delayed last year," she explained. "One of the reasons I develop these maps is to help teach people about GIS technology, which can be used in many different fields, including agriculture, health care, social services, emergency management and the sciences, mapping vegetation or wildlife."
According to Zellmer, from the 2007 to the 2012 version of her project she has made some changes. (See http://faculty.wiu.edu/LR-Zellmer/thanksgiving.html to view the project online.)
"Many states produce foods eaten at Thanksgiving, but the U.S. Department of Agriculture does not report those statistics for privacy reasons (e.g., there aren't enough farmers in the state producing enough of the crop or there might be one or two big growers or one big and small one). Until now, I have mapped those states with the 'none' or 'no data.' This time, I split them out into a 'grown but data not reported' category by setting the values for those states to 0.1, which means that people looking at the maps will see that the crop is grown, but they cannot find how much is grown in each of their states," she noted.
Zellmer also said, with the help of the WIU GIS Center, she posted the state data into ArcGIS Online (see http://bit.ly/1zhOoIU).
"This mean means that people can interact with the maps, e.g., they can turn layers on and off and query the data to see exactly how many acres of certain foods are grown in a particular state. It is a way for people to explore GIS," she added.
In addition, Zellmer would like to turn the project into an interactive story map available through ArcGIS Online. (Story maps are available at http://storymaps.arcgis.com/en/; for an example of one that explores the historic Titanic incident, see http://storymaps.esri.com/stories/titanic/.)
"I plan to start reading on how to do a swipe map, because I would like to put up both the county and state data," Zellmer noted.
For more information, contact Zellmer at (309) 298-2723 or LR-Zellmer@wiu.edu.
Posted By: Teresa Koltzenburg (WIUNews@wiu.edu)
Office of University Communications & Marketing
Connect with us: